CARDIAC SPECT IMAGING: Designation of Left Ventricular Segments
Click on each image for full color views

E ANTERIOR
I ANTEROLATERAL
J INFEROLATERAL
F INFERIOR
D INFEROSEPTAL
C ANTEROSEPTAL
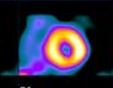
Short Axis images cut through the left ventricle from the apex to the base. Slices are arranged for interpretation on the computer screen in a standardized form for interpretation. A horizontal row display known as a “row tomogram” places the short axis stress views in the first row, with the corresponding resting views directly beneath them. The leftmost image in the display is the apical tip; the rightmost image is the valve plane at the base of the heart.
 HORIZONTAL
LONG SLICE (MID VENTRICLE)
E PROXIMAL SEPTAL
F DISTAL SEPTAL
N ANTEROAPICAL
L PROXIMAL POSTEROLATERAL
M DISTAL POSTEROLATERAL
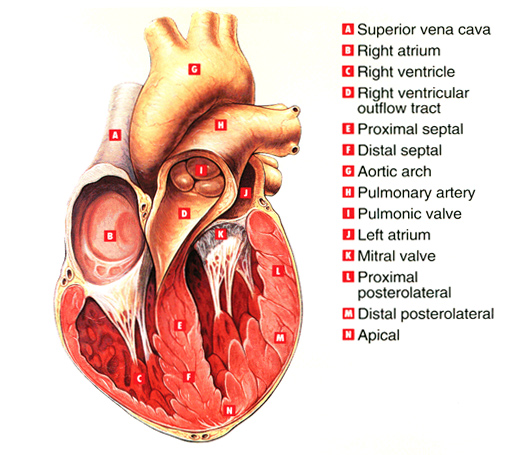
Horizontal Long images cut through the left ventricle from the posterior wall to the anterior wall (back to front). In standardized ACC displays, the apex of the left ventricle orients to 12:00 in agreement with echocardiographic displays.
VERTICAL
LONG SLICE (MID VENTRICLE)
E INFEROBASAL
F INFERIOR
K ANTEROBASAL
L ANTERIOR
M ANTEROAPICAL
N INFEROAPICAL
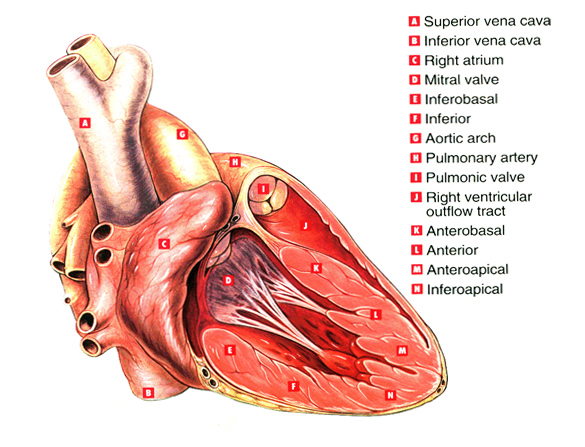
Vertical Long images cut the left ventricle from the septal wall to the lateral wall (R to L).
ROW TOMOGRAM
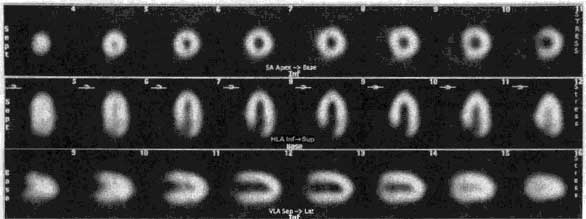
ROW 1: short axis ROW 2: horizontal long axis ROW 3: vertical long axis
I have used this graphic once again to demonstrate a standard row tomogram display; in this case, post-stress myocardial perfusion images. There are no perfusion defects present in this example. The first row shows apical through basal short axis slices. The second row shows horizontal long axis slices from the posterior wall through the anterior wall. Row three shows the vertical long axis slices from the septum through the lateral wall. Only the left ventricle is visible in these views. There is even, homogeneous uptake of the tracer in the LV with no evidence of overlying soft tissue attenuation nor subdiaphragmatic bowel, stomach, or liver activity present.
DETERMINATION OF AXES IN CARDIAC SPECT
This schematic represents the heart in the chest. SPECT data are reoriented to present the myocardium in views that are orthogonal to the major cardiac axes. The slices are called short axis views (cut from apex to base of the left ventricle), horizontal long axis views (cut from the posterior wall to the anterior wall of the left ventricle), and vertical long axis views (cut from the septum to the lateral wall).